Water Stewardship
We are committed to responsible water stewardship, as water is crucial to the resilience of our business and the communities we live and work in. Across our Company, our approach is defined at the corporate level, guided by our Global Water Stewardship Policy. At Pilgrim’s, each facility develops individual goals to promote ownership and accountability. Working closely with federal, state, and local municipalities, we collaborate to understand and tackle core challenges and develop sustainable solutions. Each facility also invests capital annually to ensure alignment with and commitment to our Environmental Policy.
Wastewater Management
We monitor wastewater treatment across our operations, following all appropriate regulatory standards. Our production and processing facilities each have a wastewater treatment program specific to their respective discharge permit requirements. Wastewater is either fully treated at our facilities or pre-treated on-site then fully treated in the municipal system — depending on the operation.
As a testament to our wastewater processing efforts, Pilgrim’s U.S. was named First Runner-Up at the United States Poultry and Egg Association Clean Water Awards for innovative wastewater treatment and water quality management.
2024 Progress
The water use indicators we measure include total water withdrawal, total water use intensity (water use per lb. of finished product), total water discharge, and total water consumption. In 2024, we used 14.8 billion gallons of water across all global facilities — with 77% of this water drawn from public municipalities, 21% from groundwater sources, and 2% from surface water, such as streams. While we increased our global water use intensity 1.3% from 2019 to 2024, we remain dedicated to reducing water use while maintaining our focus on food safety and quality.
Each Pilgrim’s facility sets water use goals and targets to encourage ownership and accountability and devotes financial resources to maintain alignment with business-specific policies and commitments. We also work cross-functionally with our environmental, engineering, operations, and food quality and safety teams when designing and implementing conservation strategies to ensure they do not interfere with water quality of food safety protocols.
Water Performance
Water Performance
Water Performance
2019 | 2020 | 2021 | 2022 | 2023 | 2024 | |
Pilgrim's U.S. | 11,405,328,895 | 11,132,706,853 | 12,427,478,095 | 12,127,837,768 | 11,954,289,938 | 12,283,850,018 |
Pilgrim's Europe | 1,379,559,414 | 1,319,962,608 | 1,814,069,403 | 2,051,029,173 | 1,721,960,614 | 1,024,260,887 |
Pilgrim's Mexico | 1,106,795,352 | 1,081,281,922 | 1,241,379,363 | 1,576,927,516 | 1,488,382,327 | 1,511,446,889 |
Water Body | Municipality | Land Application | Total | |
Pilgrim's U.S. | 3,436,556,767 | 8,297,796,179 | 911,316,635 | 12,645,669,581 |
Pilgrim's Europe | - | 909,505,891 | - | 909,505,891 |
Pilgrim's Mexico | 590,233,020 | 85,521,987 | 479,430,114 | 1,155,185,121 |
*We make every effort to report accurate data. We provide updated data from previous years in cases where improved information is available. Pilgrim’s revisited data collection processes and as a result, this report includes some improved metrics from past years.
*We make every effort to report accurate data. We provide updated data from previous years in cases where improved information is available. Pilgrim’s revisited data collection processes and as a result, this report includes some improved metrics from past years.
*We make every effort to report accurate data. We provide updated data from previous years in cases where improved information is available. Pilgrim’s revisited data collection processes and as a result, this report includes some improved metrics from past years.
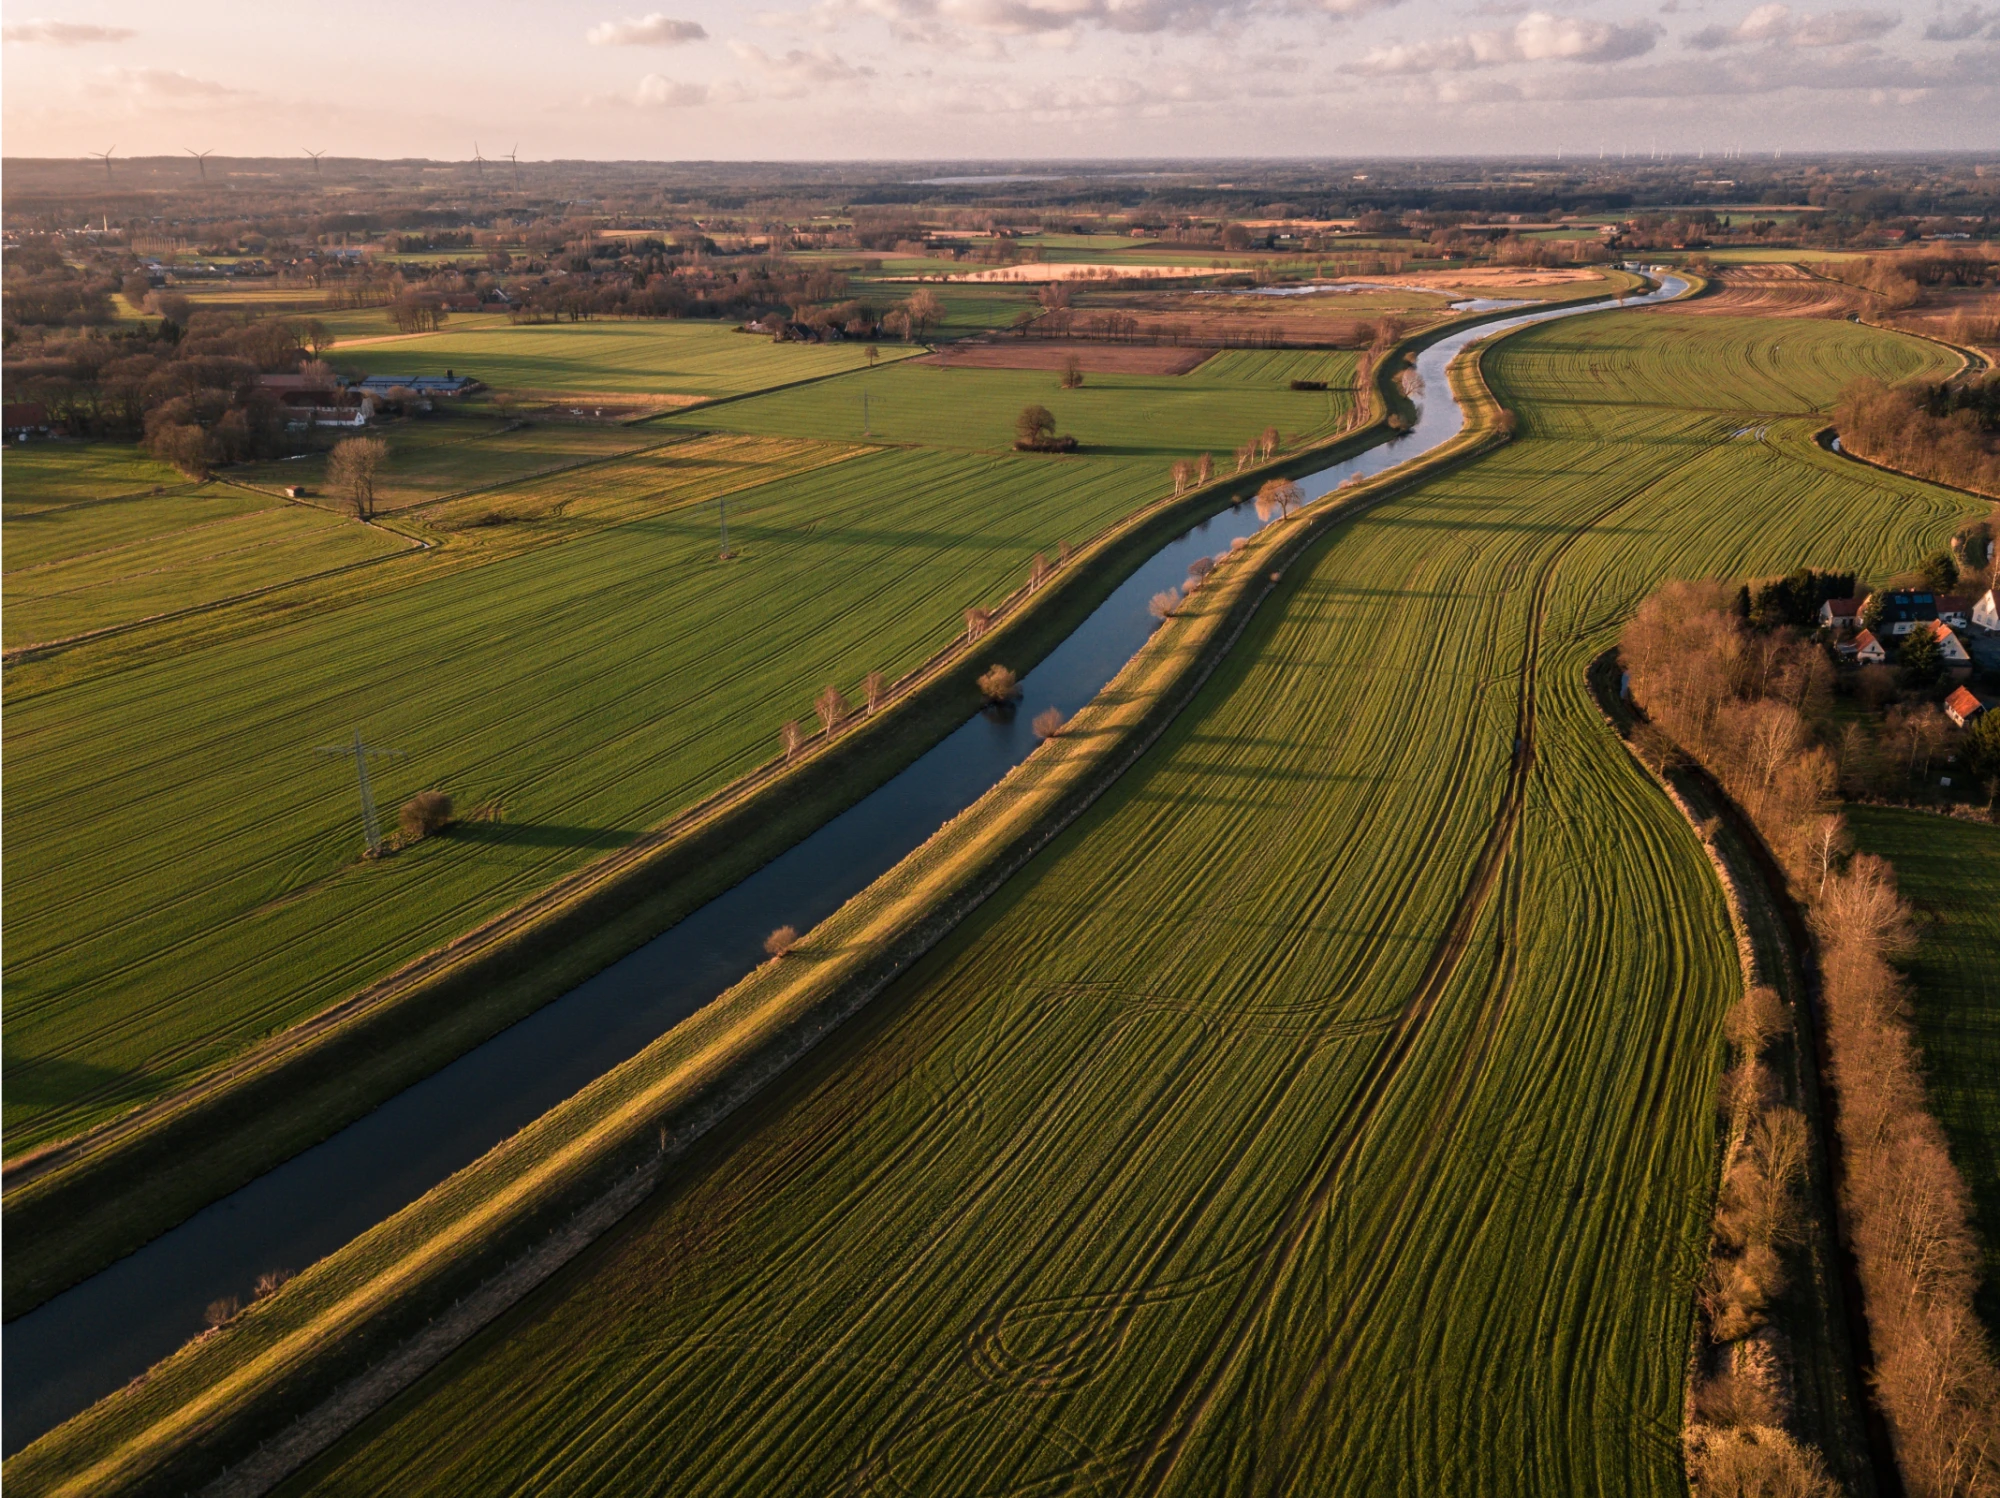
Water Risk Assessment
We see water risk assessments as critical to our strategy and have conducted a comprehensive assessment for each Pilgrim’s facility location. Key areas we evaluated include quantity (baseline water stress, inter-annual variability, seasonal variability, flood occurrence, drought severity, upstream storage, and groundwater storage), quality (return flow ratio and upstream protected land), and regulatory and reputational risk (media coverage, access to water, and threatened amphibians) for each Pilgrim’s facility location.
These assessments help us reduce the company’s overall water impact by providing us with the data necessary to identify and prioritize water resource projects relevant to each watershed.
Low | Low to Medium | Medium to High | High | Extremely High | |
Pilgrim's U.S. | 48% | 12% | 27% | 6% | 6% |
Pilgrim's Europe | 20% | 72% | 1% | 6% | 1% |
Pilgrim's Mexico | 13% | 11% | 5% | 5% | 66% |