Reducing Energy & Greenhouse Gasses
Our environmental teams work to implement best practices for energy efficiency and to reduce GHG emissions across our operations. We continuously invest in energy efficient technologies including LED lighting, real-time measurement devices and predictive maintenance, more efficient equipment, electrification of heating systems and transportation and more efficient refrigeration systems. We are continuing to explore opportunities to use waste-to-energy processes. To date, two of our facilities use biogas as a renewable energy source, and 100% of the electricity that our Pilgrim's UK and Pilgrim's Food Masters facilities source is renewable. Globally, 15.5% of our indirect energy came from renewable sources in 2022, which we are steadily increasing across operations.
From 2019 to 2022, Pilgrim's Global decreased total energy use intensity by 3.8% and fuel use intensity by 5.6%, while unfortunately increasing electricity use intensity by 0.4%. Our teams will continue to stay focused on reducing energy use throughout our operations, while also increasing the amount of renewable energy that we purchase and generate to meet our 60% renewable electricity goal by 2030.
Within our operations, we track direct GHG emissions from stationary and mobile sources (scope 1), including emissions from the live animal operations owned by Pilgrim's, and indirect energy emissions (scope 2). From 2019 to 2022, we reduced our scope 1 & 2 GHG emission intensity by 19.9% across all Pilgrim's operations, while also reducing our absolute scope 1 & 2 GHG emissions by 18.7%. We will continue to work toward our interim target to achieve a 30% reduction in scope 1 & 2 GHG emission intensity by 2030, and report progress annually.
In addition to reporting our performance in our annual sustainability report, Pilgrim's discloses to the Carbon Disclosure Project (CDP) each year through our parent company, JBS. Please find our 2023 Climate Change Questionnaire available here for further information on our emissions and Board oversight of climate-related performance.
2022 Progress
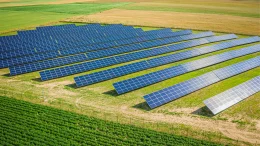
To reach our net zero goal, we are investing in emissions reductions projects and growing our use of renewable electricity.
2022 Progress
To reach our net zero goal, we are investing in emissions reductions projects and growing our use of renewable electricity.
2022 Progress
To reach our net zero goal, we are investing in emissions reductions projects and growing our use of renewable electricity.
Pilgrim's is the first major global protein company to pledge a net-zero GHG emissions by 2040 target, covering scope 1, scope 2, and scope 3 emissions.
Energy Performance*
Energy Performance*
Energy Performance*
*We make every effort to report accurate data. We provide updated data from previous years in cases where improved information is available. Pilgrim’s revisited data collection and as a result, this report includes some improved metrics from past years.
**Includes Pilgrim’s Moy Park, Pilgrim’s UK, and Pilgrim's Food Masters (2021 and 2022 only).
***Includes all scope 1 energy
GHG Performance*
GHG Performance*
GHG Performance*
2019 | 2020 | 2021 | 2022 | |
U.S. & Puerto Rico | 0.0117 | 0.0110 | 0.0106 | 0.0100 |
Mexico | 0.0148 | 0.0145 | 0.0131 | 0.0131 |
Europe** | 0.0106 | 0.0096 | 0.0102 | 0.0077 |
2019 | 2020 | 2021 | 2022 | |
U.S. & Puerto Rico | 0.0115 | 0.0107 | 0.0107 | 0.0104 |
Mexico | 0.0148 | 0.0145 | 0.0131 | 0.0131 |
Europe** | 0.0093 | 0.0098 | 0.0112 | 0.0083 |
*We make every effort to report accurate data. We provide updated data from previous years in cases where improved information is available. Pilgrim’s revisited data collection and as a result, this report includes some improved metrics from past years.
**Includes Pilgrim’s Moy Park, Pilgrim’s UK, and Pilgrim's Food Masters (2021 and 2022 only).
Our Stories
Our Stories